UTILISING TECHNOLOGY FOR GREATER ACCURACY
Surveying
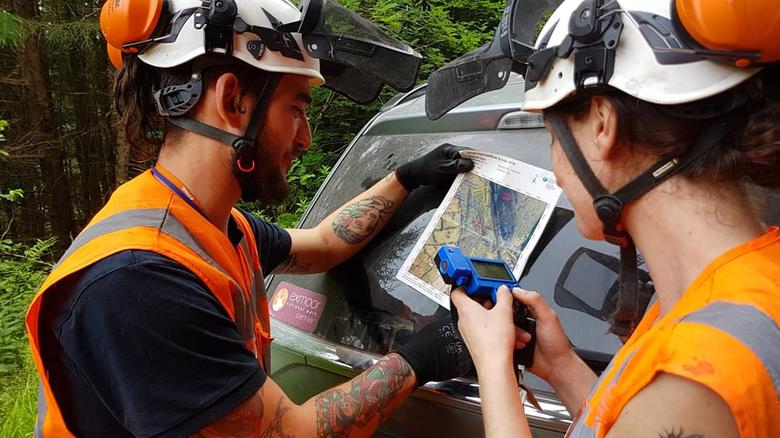
Our Surveying & Inventory services incorporate the latest woodland surveying technology, software and specialist knowledge to gather accurate forest data. Providing owners and managers with reliable information about their timber stocks and woodlands.
Woodland Inventories & Valuations
Providing a detailed woodland inventory is a fundamental cornerstone for woodland planning. By gathering data about the volume, grade, yield, species, stocking and variability of a woodland we are able to advise owners about the health and productivity of their land. Whether managed for commercial or recreational purposes, these surveys enable managers to understand their current and future resources.
Sample Plotting
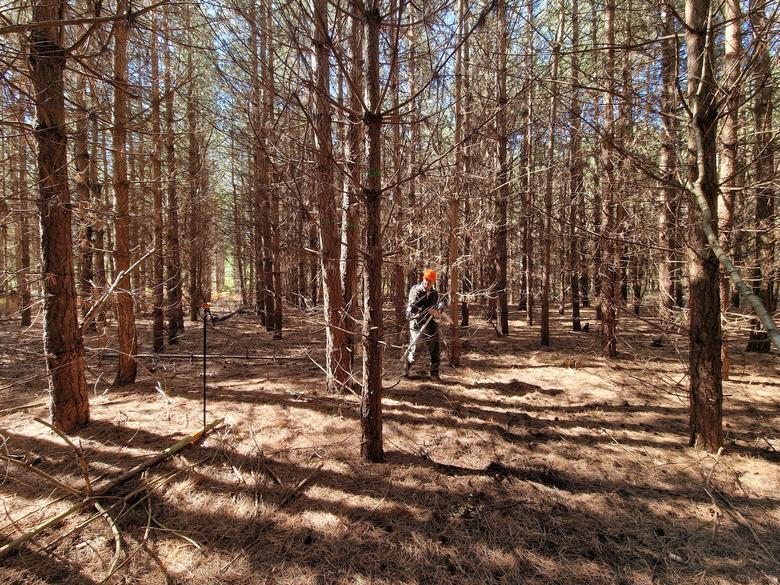
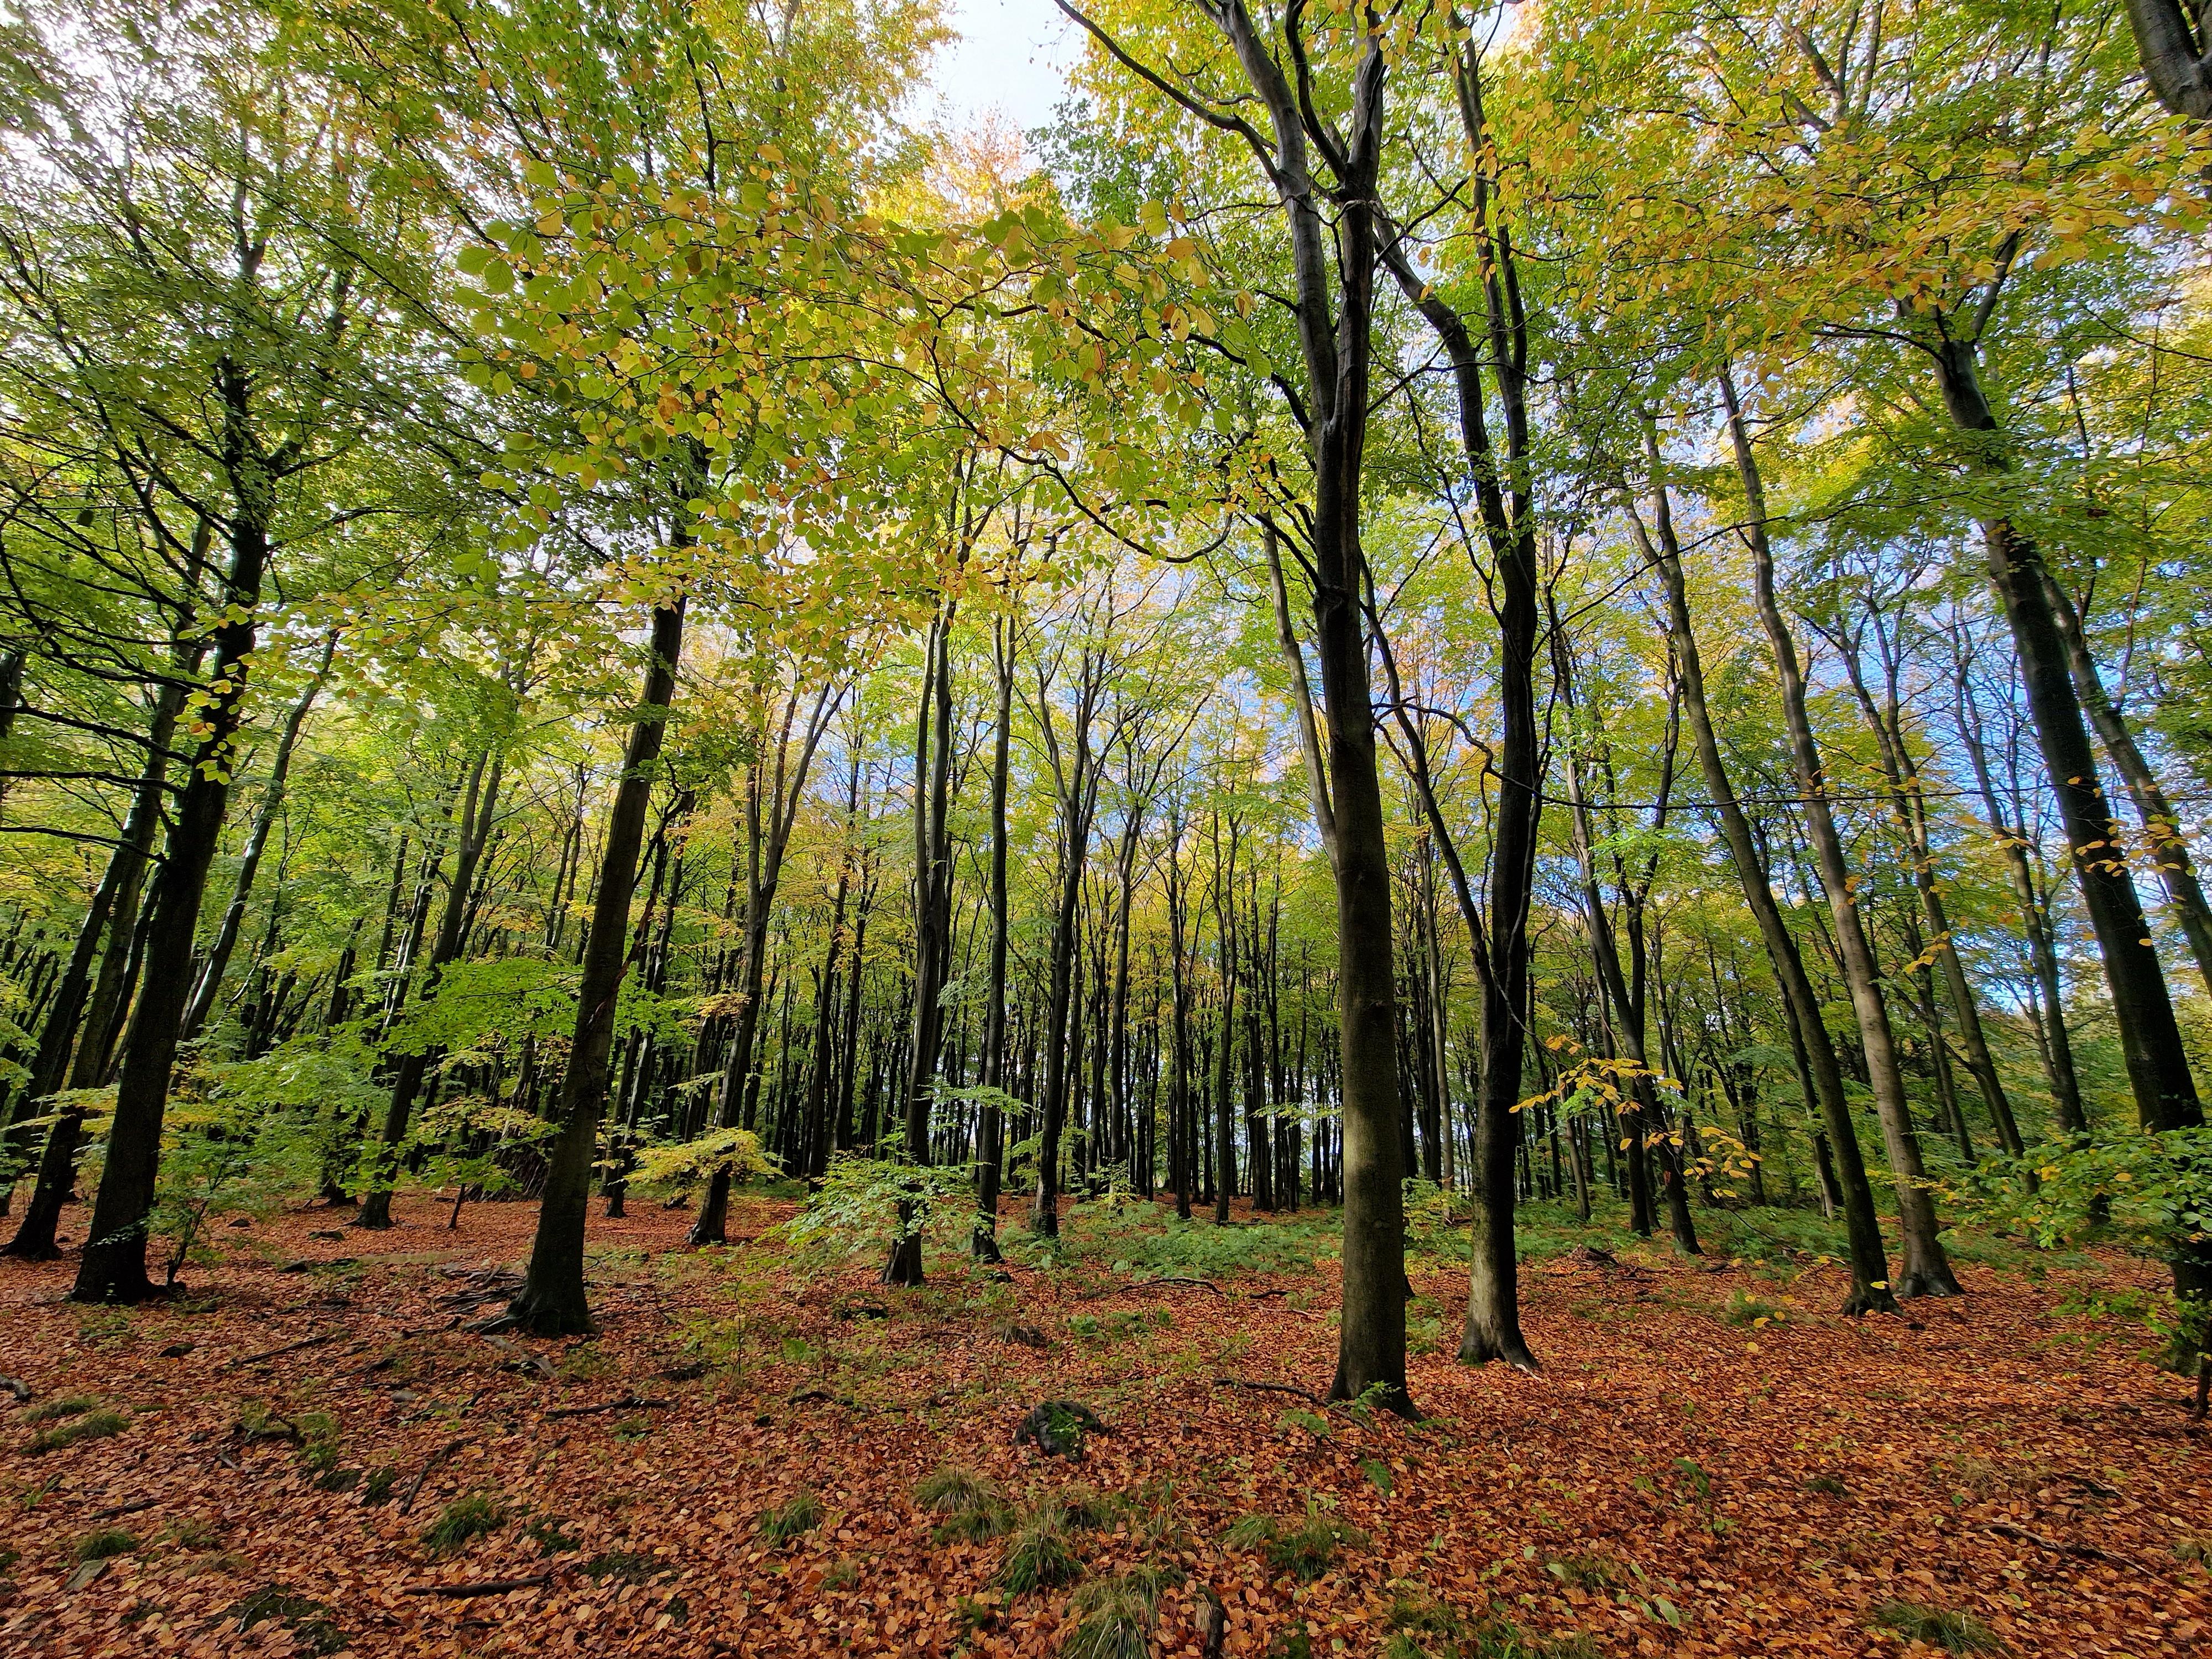
Our sample plotting service is a fundamental offering that delivers precise metrics for your woodland in a cost-effective manner. By collecting data on tree species, age, diameter, height, and quantity, we can accurately estimate tree volumes in a given area. This information allows us to calculate tree growth, providing essential insights for timber forecasting, identifying tree health concerns, and developing woodland management plans.
Tariffing
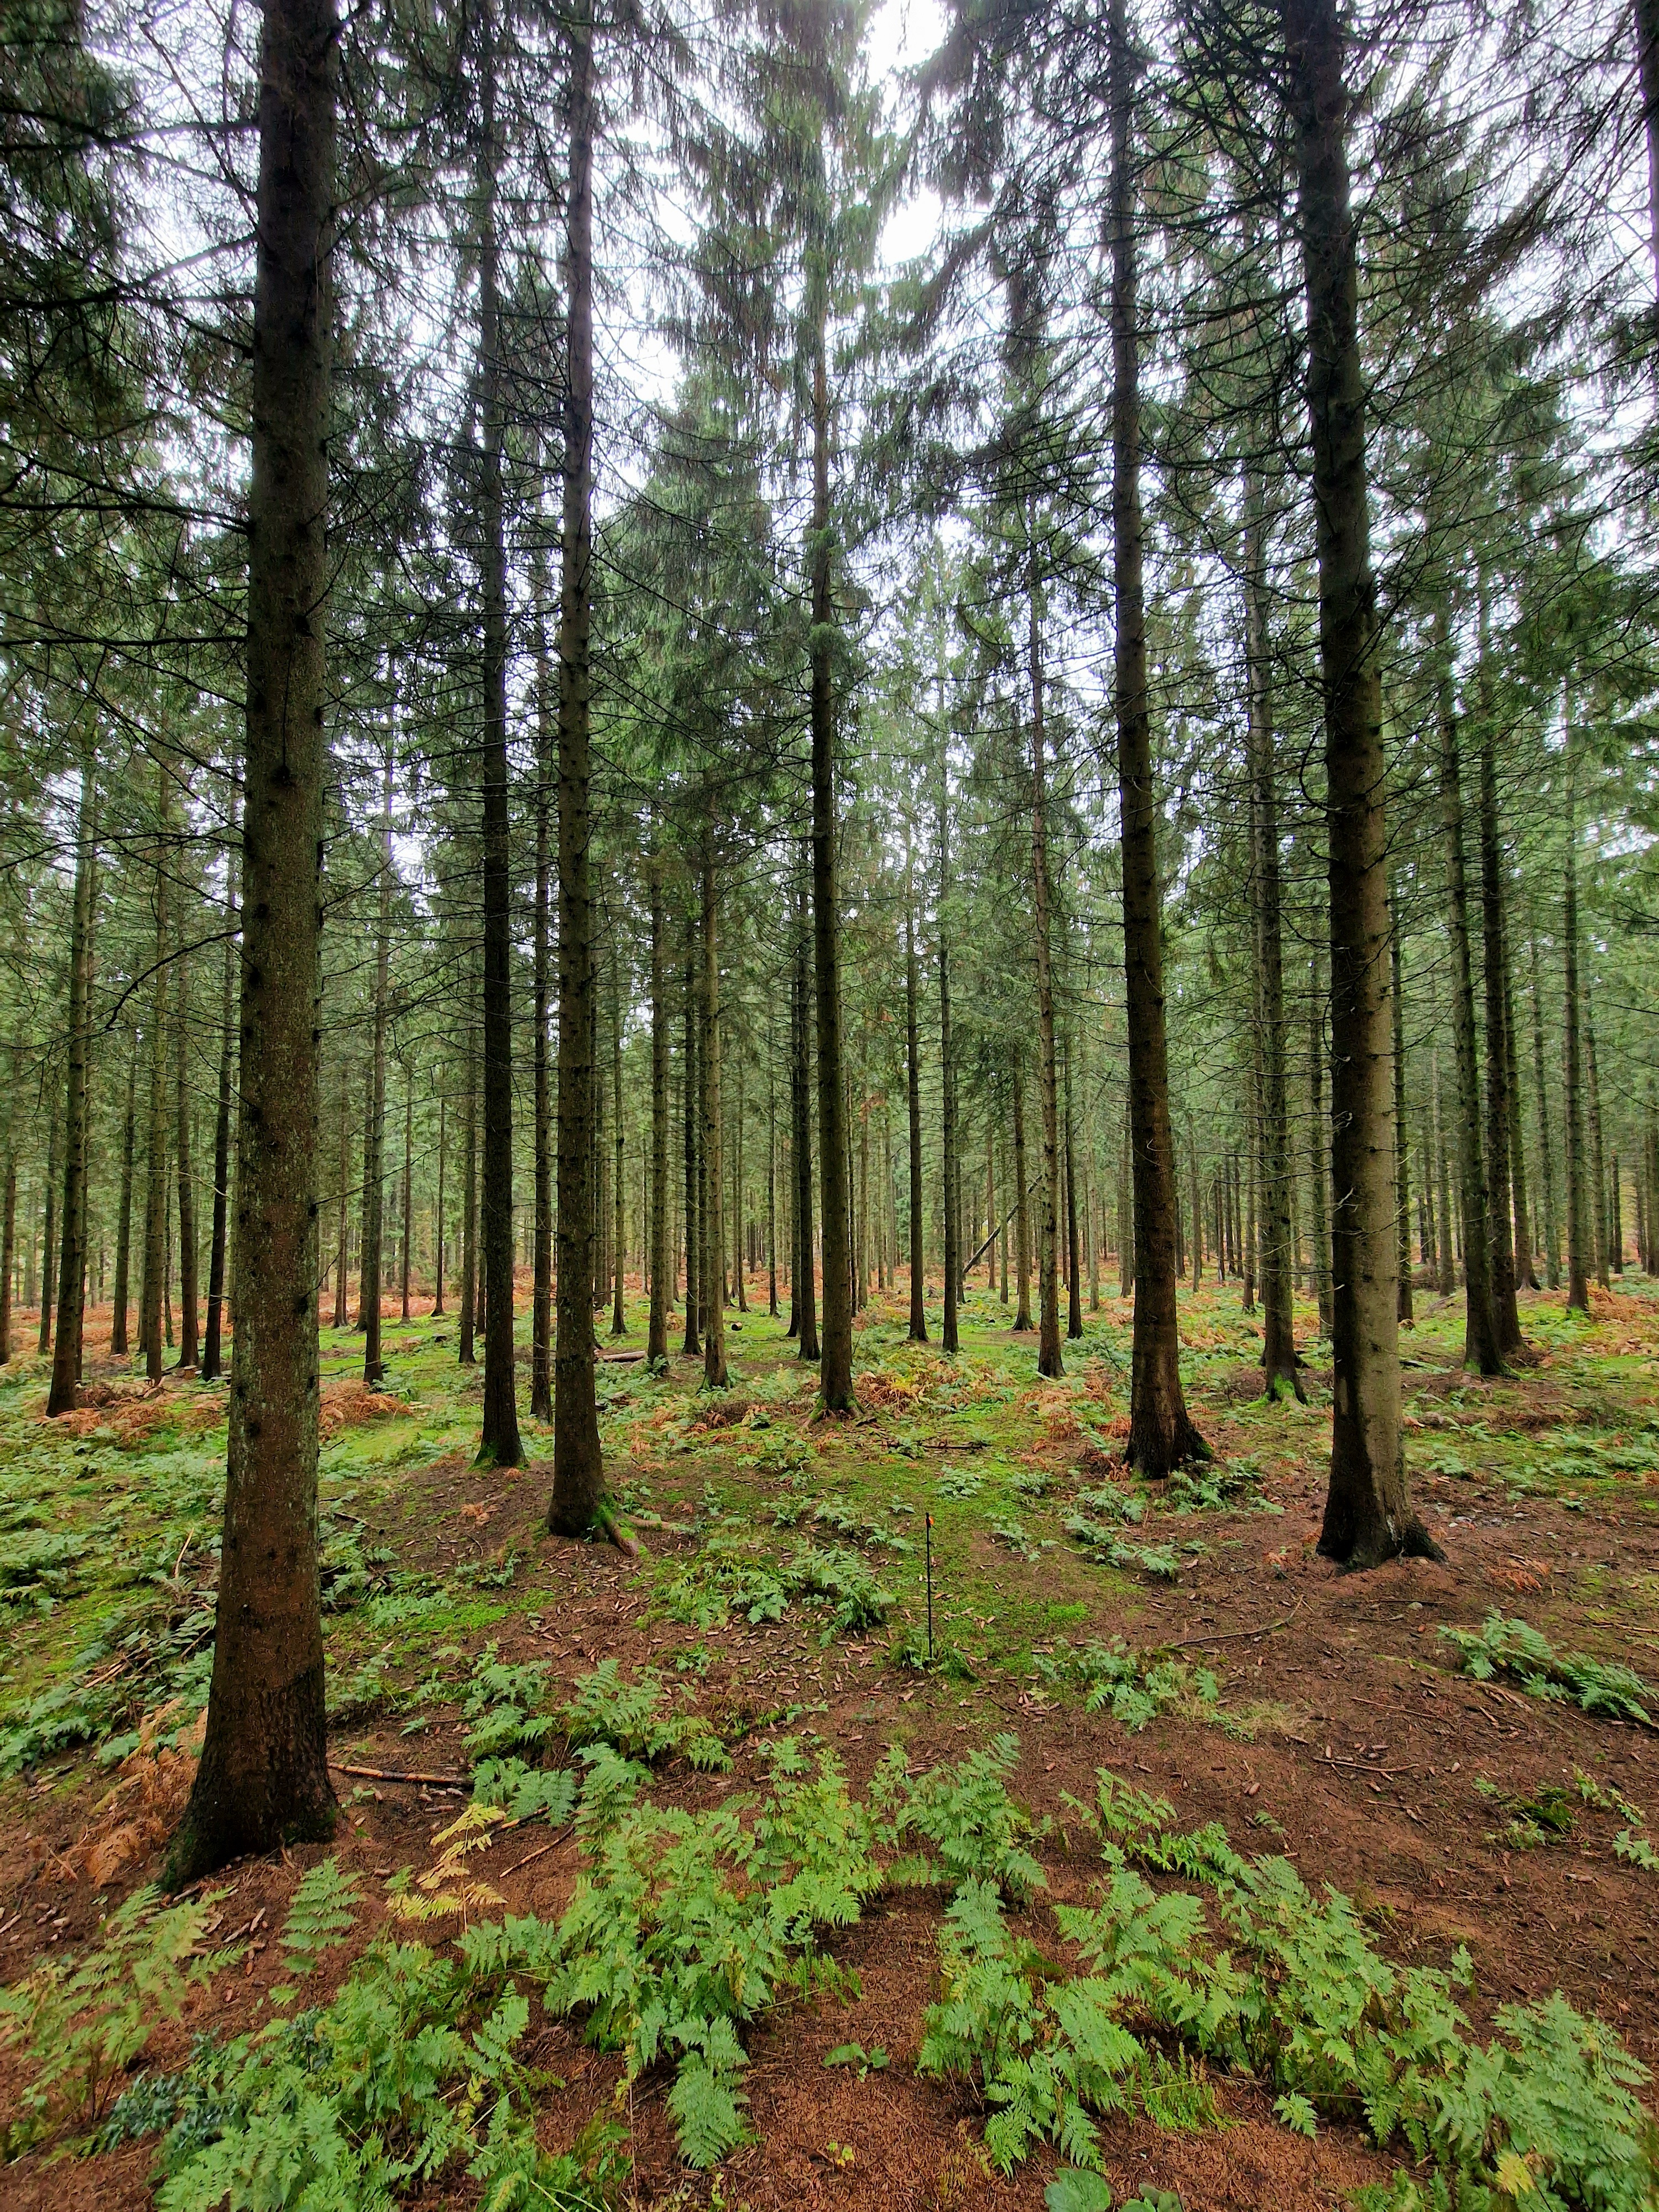
Tariffing involves the comprehensive counting of every tree within a specified area, resulting in a more detailed dataset. Similar to sample plotting, we collect data on tree species, age, diameter, height, and quantity. This approach is particularly beneficial during operations like thinnings, providing in-depth information about the trees being removed. It proves especially valuable when assessing high-value crops for selective thinning and final clear felling.

Woodland Creation & Establishment
Stocking Density Assessments (SDA) serve as a crucial measure to evaluate the success of a woodland establishment project. Implementing a robust assessment process is essential for pinpointing areas of concern, comprehending their underlying causes, and planning subsequent beat-up planting efforts. SDAs play a vital role in ensuring grant compliance and are integral to the verification process for the Woodland Carbon Code. Establishing a thorough understanding of stocking density is key to the overall effectiveness and sustainability of woodland creation initiatives.

Yield Class Assessments
Yield class assessments are a way to measure the growth of trees in a group of the same age, with a specific focus on the standing volume of wood they produce. This involves collecting data on the height and age of the trees, providing a useful metric for evaluating their growth within a stand. Compared to other methods like sample plotting and tariffing, this process is less intensive but remains highly valuable in assessing tree development.
When measuring for timber sales
So why survey?
Using accurate data when making decisions about your woodland resource gives you confidence in your forest management decisions. Using sound forest metrics derived from an objective assessment process adds value to the figures and increases customer confidence. When selling timber standing it is imperative you undertake the correct type of survey to accurately represent the stand and realise it's true value. Using incorrect or out of date data will inevitably lead to poor management.
The need for conventions
In forestry, measuring precisely is tough because wood products are diverse. Usually, we estimate volumes instead of measuring exactly. There are various methods to estimate how much timber there is, and they can give different results. Even a small log can be measured in multiple ways. So, it's crucial to understand how we survey and the rules we follow when working out the volumes of timber. This helps make sure there is a clear understanding of the data and the true meaning of the volume estimates.
Costs & Benefits
Measuring your woodland has costs and bring benefits. When figuring out how much wood you have for a particular outcome, you need to decide how exact you want the assessment to be. Usually, being more exact costs more money. For example, if you want to measure a log's volume very precisely, it takes more effort and, therefore, costs more.
The price you're willing to pay for precise measurements levels out even though the cost of measuring more precisely goes up. There's an optimum point at which the difference between assessment cost and timber price is the biggest. This sweet spot depends on two things: how valuable the wood is and how much of it you're dealing with. If the wood is expensive or you have a lot of it, it makes sense to pay more for precise measurements to reduce the risk of making mistakes.
In a nutshell, when it comes to measuring timber in forestry, you have to think about how much it costs, what benefits you get, how valuable the wood is, and how much of it you have. You want to find the right balance that fits your needs.
GIS Surveys
Using the latest geospatial technology and real time aerial photography, we gather data on multiple aspects of a site. Whether geolocating boundaries, identifying individual tree health issues, modelling storm damage, or measuring roadside products stocks. We can interpret, analyse and collate this information and turn it into a GIS compatible resource, giving you the ability to make informed decisions based on sound data.
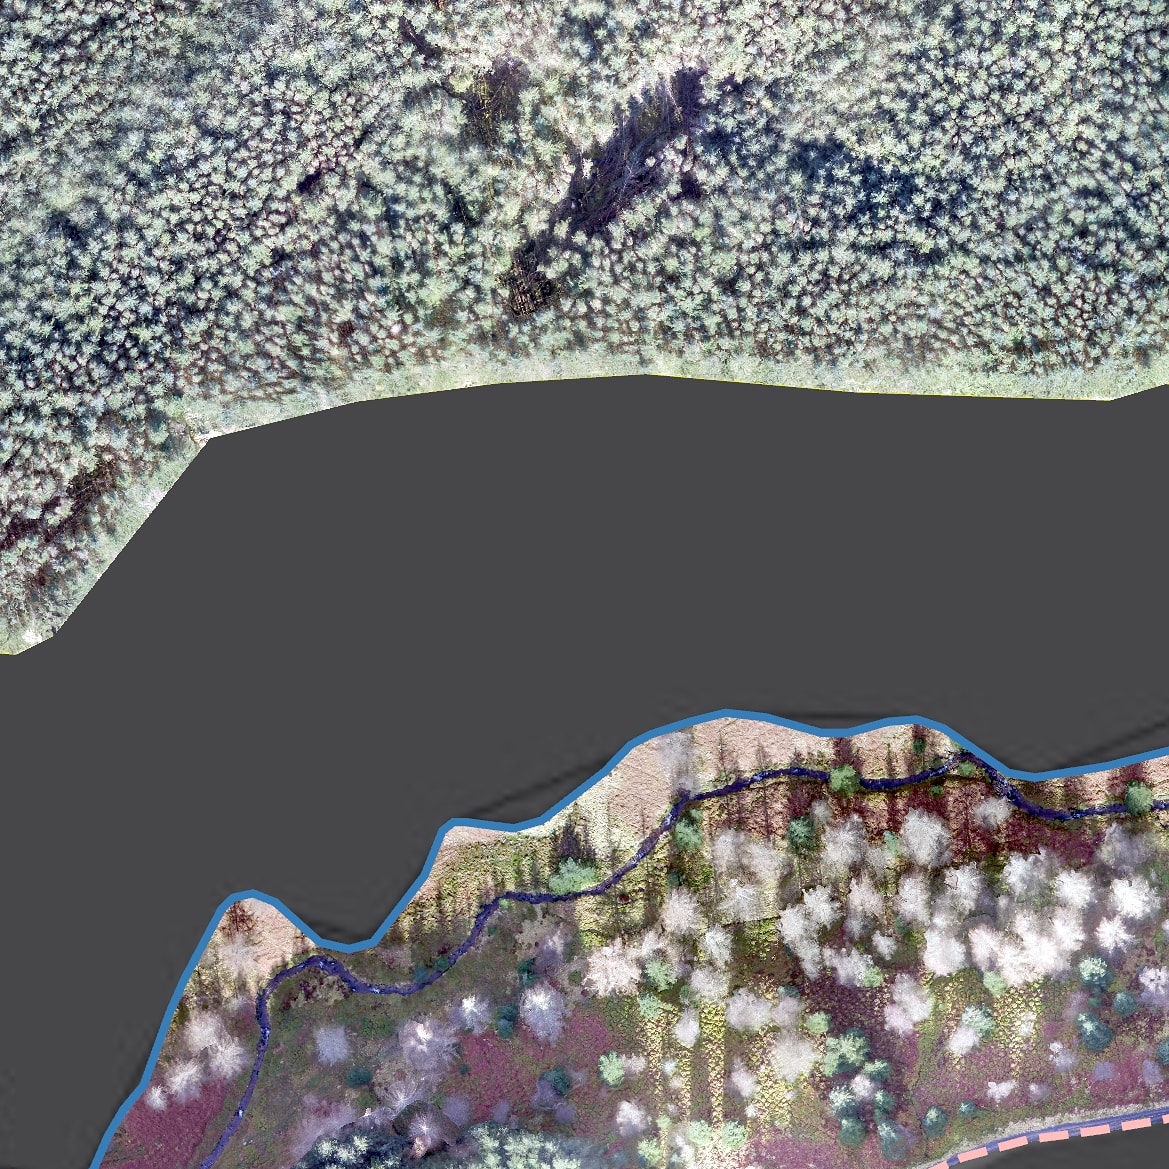
Woodland Mapping
Compartment mapping is essential for gaining a comprehensive understanding of a woodland. Accurately measuring and compartmentalising areas is crucial, involving collecting both geospatial and attribute data. Understanding the size, shape, and composition of the woodland enables informed planning. This process can be carried out using satellite or drone imagery through a desk-based approach, field surveys employing mapping software, or a combination of both methods.
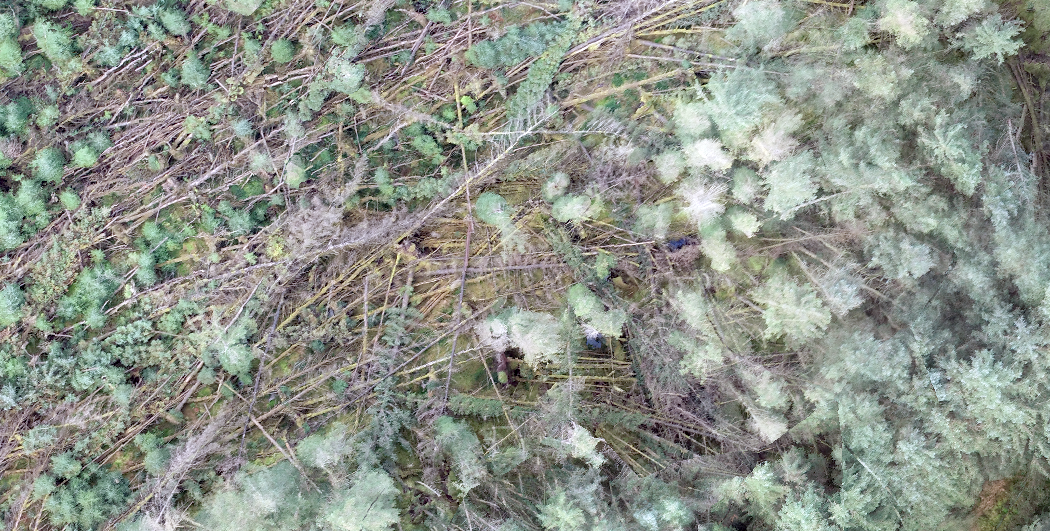
Storm Damage
Storm damage mapping is very important as the impact of unpredictable and severe weather patterns intensifies due to climate change. Employing drone imagery, NDVI imagery, and field surveys, we can effectively quantify the damage inflicted on woodlands by high winds, flooding, and drought. This information is vital for recovery, mitigation, and insurance purposes, helping stakeholders better understand and address the challenges posed by changing environmental conditions.
Tree Surveys
Mapping trees and other vegetation is important for many applications such as tree health issues, pest and diseases, research projects, truthing remote-sensing data and monitoring forest regeneration. Using unique systems designed to cope with challenging environments, our operators can gather highly accurate geospatial data about each attribute within a sample area.
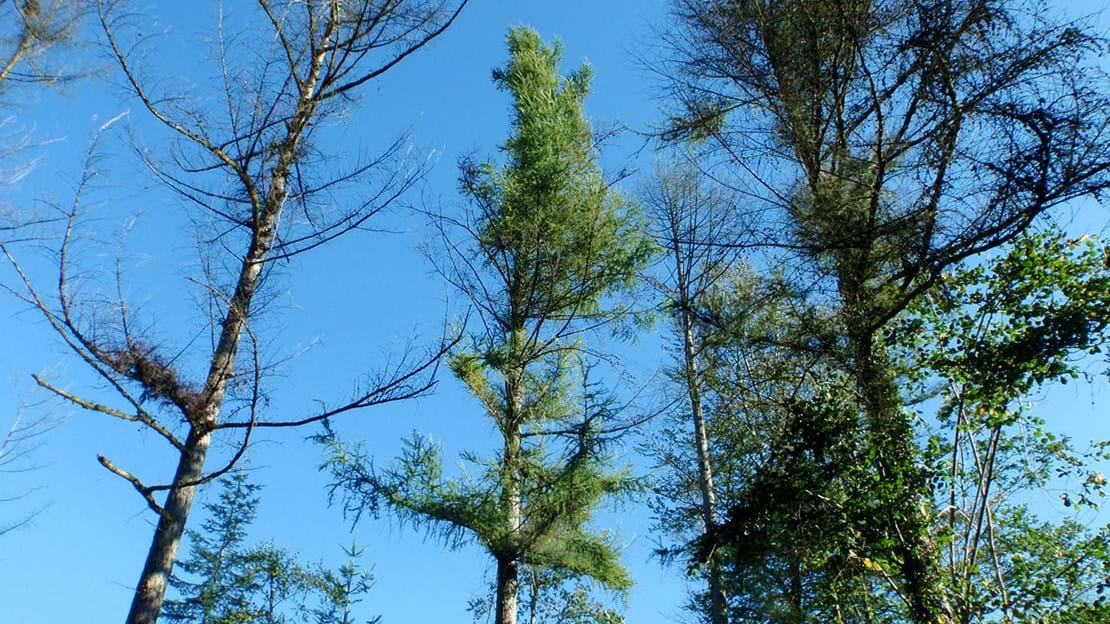
Pests & Diseases
Effectively identifying pests and diseases is crucial for comprehending their scale and implications on tree health. Our proven expertise lies in surveying and detecting issues related to tree diseases and pathogens, such as Phytophthora Ramorum and Ash Dieback. Additionally, we excel in identifying tree pest infestations, including Oak Processionary Moth and Dendroctonus Micans. If you have concerns regarding any of these issues, Forest Research Tree Alert should be your first point of contact.
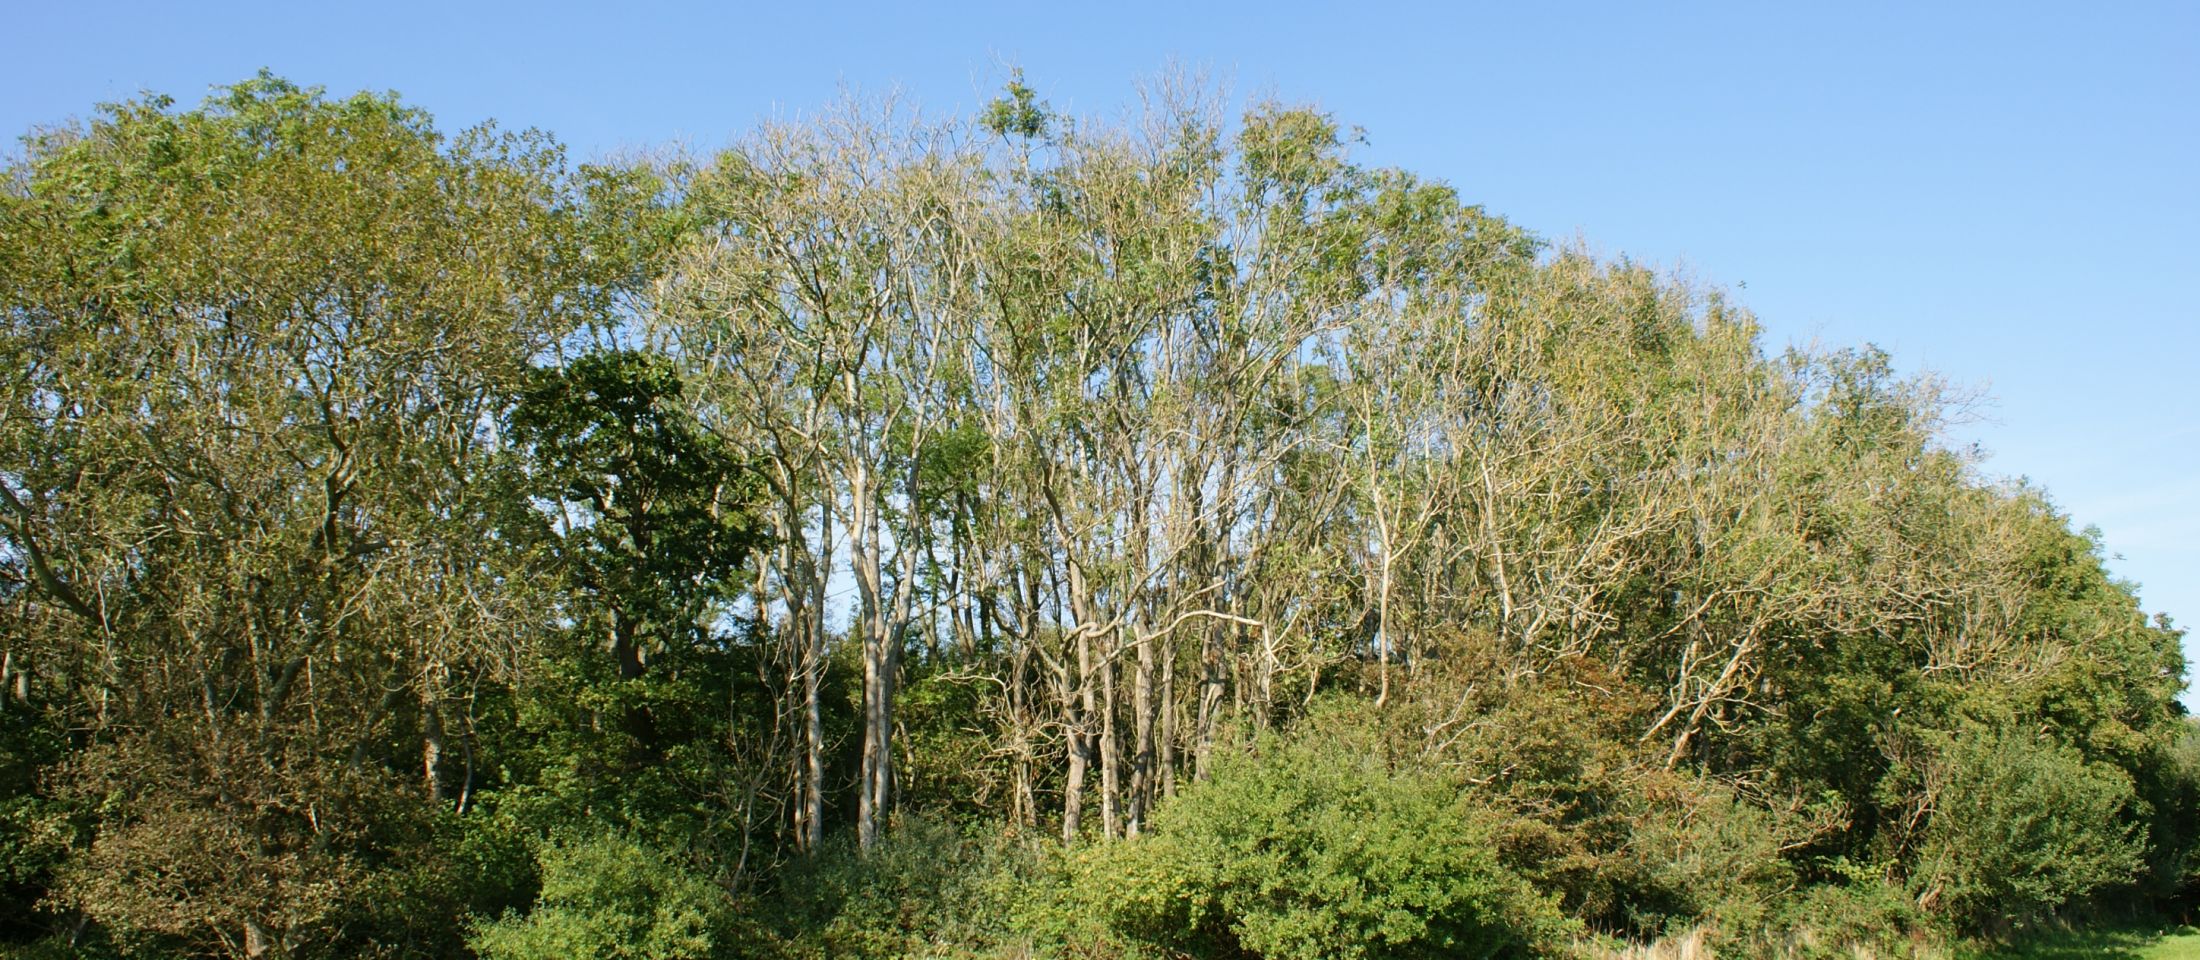
Tree Health
As tree diseases continue to impact tree species in the UK, establishing a robust method for identifying and monitoring tree safety is crucial for landowners' liability. Our team excels in identifying and reporting on the extent of tree safety issues arising from tree diseases. Additionally, we can assess recoverable timber to evaluate potential products following a tree health notice, aiding in mitigating financial losses. This proactive approach ensures a comprehensive understanding of tree health, contributing to responsible land management.
